上周尝试对一个 sql 进行优化,原先 sql 中存在【依赖子查询(DEPENDENT SUBQUERY)】,优化后变成了【嵌套循环联接(NESTED LOOPS)】,但是最终执行耗时反而更长了。本篇就调查下为什么会出现这个情况。
执行计划的阅读顺序 上一篇中列出了各个 sql 的执行计划,也给出了对于执行计划的解释。但是实际上阅读的方式是有问题的,以下面的 sql 为例:
1
2
3
4
5
6
7
8
9
10
11
12
13
14
select A.user_uid, A.create_date, B.record_uidfrom ( select * from t_app_user where is_delete = 0 group by user_uid ) A left join ( select * from t_app_login_record where is_delete = 0 group by record_uid ) B using (user_uid);
它的执行计划如下:
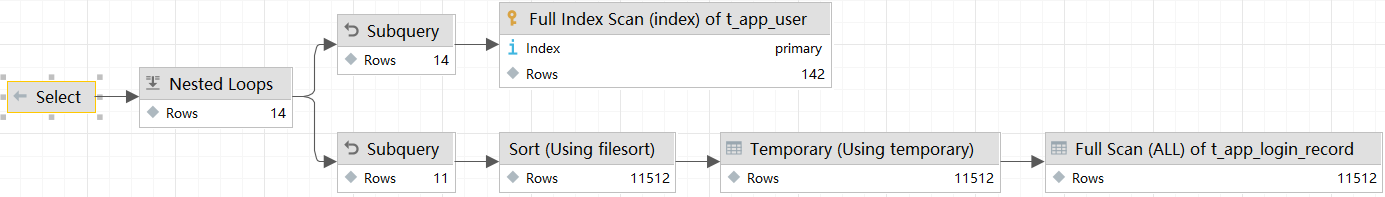
在 IDEA 中,还可以通过图表的方式查看,如下:
按照正常的阅读习惯,我们都是【从上向下】、【从左往右】看,但实际上正确的阅读顺序应该是【按照 id 从大到小】、【从右向左】阅读。具体参考:MySQL执行计划
在所有组中,id值越大,优先级越高,越先执行,id如果相同,可以认为是一组,从上往下顺序执行
上面两种执行计划都比较简略,实际分析执行计划时,可以通过 explain format=json 查看完整的执行计划。
优化后 SQL 为何耗时会更长 回到最初提出的问题:为何 sql 从【依赖子查询】优化到【循环嵌套联接】后,耗时反而更长了?
首先简化一下 sql 语句,上一篇给出的 sql 语句都是 Mybatis 代码,下面直接给出具体 sql 执行语句,剔除多余的干扰因素,如下:
1
2
3
4
5
6
7
8
9
10
11
12
13
14
15
16
17
# ==== 原 sql ==== select * from t_app_circleinfo i where user_uid = '02bc1fcd63514e80a7ae0a74c19945fa' and moment_type = 0 and ( limit_user = 0 or ( IF((select FIND_IN_SET('9db162b3935c4c649b47dc02ab989062', limit_uid) from t_app_circleinfo_look l where i.info_uid = l.info_uid and l.is_delete = 0) = 0, limit_user = 3, limit_user = 2) ) ) and auth_status = 2 ORDER BY update_date DESC;
使用 join 优化后 sql 语句如下:
1
2
3
4
5
6
7
8
9
10
11
12
13
14
15
16
17
18
# ==== 优化后的 sql ==== select A.* from t_app_circleinfo A left join t_app_circleinfo_look B on A.info_uid = B.info_uid and B.is_delete = 0 and B.limit_uid like '%9db162b3935c4c649b47dc02ab989062%' where A.user_uid = '02bc1fcd63514e80a7ae0a74c19945fa' and A.moment_type = 0 and ( A.limit_user = 0 or ( IF(B.info_uid is null, A.limit_user = 3, A.limit_user = 2) ) ) and A.auth_status = 2 ORDER BY A.update_date DESC;
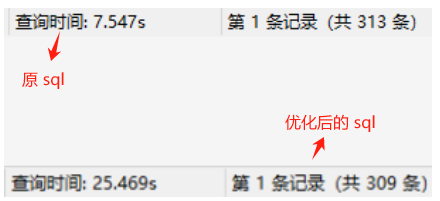
将涉及到的两张表扩充,t_app_circle_info 增加 100w 条数据,t_app_circleinfo_look 增加 10w 条数据。两个 sql 执行后的耗时情况如下:
与上一篇的测试结果一样,优化后的 sql 耗时反而更慢了。这里两条 sql 的查询结果有些不一样,经过调查,优化后的 sql 结果才是正确的。原 sql 存在的这个问题并不影响后续的分析,因此后续的分析仍然基于上面的两个 sql(注:关于原 sql 查询结果有误的分析见下面的 【原 sql 执行耗时分析】 )
接着看下为何优化后的 sql 执行耗时会这么长,执行计划如下:
用 explain format=json 输出详细的执行计划:
1
2
3
4
5
6
7
8
9
10
11
12
13
14
15
16
17
18
19
20
21
22
23
24
25
26
27
28
29
30
31
32
33
34
35
36
37
38
39
40
41
42
43
44
45
46
47
48
49
50
51
52
53
54
55
56
{ "query_block" : { "select_id" : 1 , "cost_info" : { "query_cost" : "114198686.75" }, "ordering_operation" : { "using_temporary_table" : true , "using_filesort" : true , "cost_info" : { "sort_cost" : "94979718.34" }, "nested_loop" : [ { "table" : { "table_name" : "A" , "access_type" : "ALL" , "rows_examined_per_scan" : 837571 , "rows_produced_per_join" : 837 , "filtered" : "0.10" , "cost_info" : { "read_cost" : "178607.69" , "eval_cost" : "167.51" , "prefix_cost" : "178775.20" , "data_read_per_join" : "13M" }, "used_columns" : [ ... ], "attached_condition" : "((`test`.`a`.`auth_status` = 2) and (`test`.`a`.`moment_type` = 0) and (`test`.`a`.`user_uid` = '02bc1fcd63514e80a7ae0a74c19945fa'))" } }, { "table" : { "table_name" : "B" , "access_type" : "ALL" , "rows_examined_per_scan" : 113399 , "rows_produced_per_join" : 94979718 , "filtered" : "100.00" , "using_join_buffer" : "Block Nested Loop" , "cost_info" : { "read_cost" : "44249.54" , "eval_cost" : "18995943.67" , "prefix_cost" : "19218968.41" , "data_read_per_join" : "53G" }, "used_columns" : [ ... ], "attached_condition" : "(<if>(found_match(B), ((`test`.`a`.`limit_user` = 0) or if(isnull(`test`.`b`.`info_uid`),(`test`.`a`.`limit_user` = 3),(`test`.`a`.`limit_user` = 2))), true) and <if>(is_not_null_compl(B), ((`test`.`b`.`is_delete` = 0) and (`test`.`b`.`info_uid` = `test`.`a`.`info_uid`) and (`test`.`b`.`limit_uid` like '%9db162b3935c4c649b47dc02ab989062%')), true))" } } ] } } }
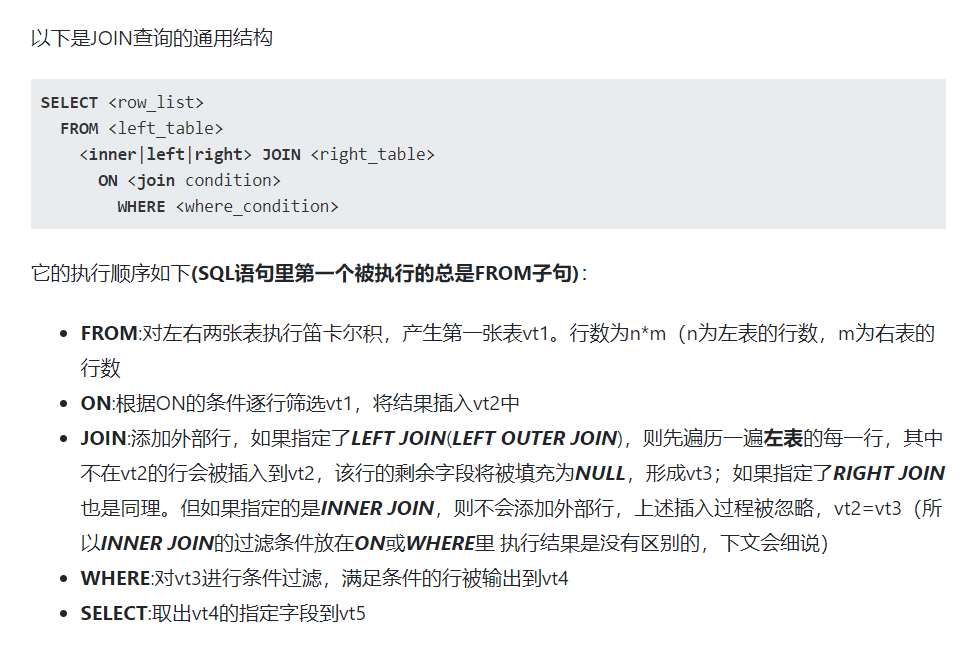
上面我隐藏了一些非必要的信息,可以看到,在 Nested Loop 中,B 表与 A 表连接后产生的行数 rows_produced_per_join 达到了 9000W 条。问题原因找到了,原先使用 join 优化原 sql 时,想的是优化后的 sql 能够先执行 on 条件,再执行 join 连接。但是实际上先执行的 join 连接,将两表全部的数据进行了关联,然后才执行的 on 条件,导致数据量过大。
在 Mysql - JOIN详解 中给出了 join 查询语句的执行顺序,如下:
使用派生表优化 sql 上面的 sql 耗时过长的原因是 先执行了 join 联表操作,之后才执行 on 进行条件筛选 。如果能想个办法,让 sql 先执行 on 条件筛选,再进行联表操作,那么耗时过长的问题是不是就能解决呢?
尝试进行了如下优化:
1
2
3
4
5
6
7
8
9
10
11
12
13
14
15
16
17
18
19
20
# ==== 二次优化后的 sql ==== select A.* from t_app_circleinfo A left join (select info_uid from t_app_circleinfo_look where is_delete = 0 and limit_uid like '%9db162b3935c4c649b47dc02ab989062%' ) as B using(info_uid) where A.user_uid = '02bc1fcd63514e80a7ae0a74c19945fa' and A.moment_type = 0 and ( A.limit_user = 0 or ( IF(B.info_uid is null, A.limit_user = 3, A.limit_user = 2) ) ) and A.auth_status = 2 ORDER BY A.update_date DESC;
在执行联表操作前,先从 t_app_circleinfo_look 表中筛选出来部分数据,将生成的临时结果集与 t_app_circleinfo 表进行关联。运行 sql,耗时好像没有变化…
看下它的执行计划:
1
2
3
4
5
6
7
8
9
10
11
12
13
14
15
16
17
18
19
20
21
22
23
24
25
26
27
28
29
30
31
32
33
34
35
36
37
38
39
40
41
42
43
44
45
46
47
48
49
50
51
52
53
54
55
56
{ "query_block" : { "select_id" : 1 , "cost_info" : { "query_cost" : "114198686.75" }, "ordering_operation" : { "using_temporary_table" : true , "using_filesort" : true , "cost_info" : { "sort_cost" : "94979718.34" }, "nested_loop" : [ { "table" : { "table_name" : "A" , "access_type" : "ALL" , "rows_examined_per_scan" : 837571 , "rows_produced_per_join" : 837 , "filtered" : "0.10" , "cost_info" : { "read_cost" : "178607.69" , "eval_cost" : "167.51" , "prefix_cost" : "178775.20" , "data_read_per_join" : "13M" }, "used_columns" : [ ... ], "attached_condition" : "((`test`.`a`.`auth_status` = 2) and (`test`.`a`.`moment_type` = 0) and (`test`.`a`.`user_uid` = '02bc1fcd63514e80a7ae0a74c19945fa'))" } }, { "table" : { "table_name" : "t_app_circleinfo_look" , "access_type" : "ALL" , "rows_examined_per_scan" : 113399 , "rows_produced_per_join" : 94979718 , "filtered" : "100.00" , "using_join_buffer" : "Block Nested Loop" , "cost_info" : { "read_cost" : "44249.54" , "eval_cost" : "18995943.67" , "prefix_cost" : "19218968.41" , "data_read_per_join" : "53G" }, "used_columns" : [ ... ], "attached_condition" : "(<if>(found_match(t_app_circleinfo_look), ((`test`.`a`.`limit_user` = 0) or if(isnull(`test`.`t_app_circleinfo_look`.`info_uid`),(`test`.`a`.`limit_user` = 3),(`test`.`a`.`limit_user` = 2))), true) and <if>(is_not_null_compl(t_app_circleinfo_look), ((`test`.`t_app_circleinfo_look`.`info_uid` = `test`.`a`.`info_uid`) and (`test`.`t_app_circleinfo_look`.`is_delete` = 0) and (`test`.`t_app_circleinfo_look`.`limit_uid` like '%9db162b3935c4c649b47dc02ab989062%')), true))" } } ] } } }
这与上面的执行计划一模一样,仍然是先进行了 t_app_circleinfo 和 t_app_circleinfo_look 的全表关联操作。详细看下 t_app_circleinfo_look 中的 attached_condition,如下:
1
2
3
4
5
6
7
8
9
10
11
12
13
14
15
16
17
18
19
20
21
22
23
( # 代码块1 <if>(found_match(B), ( (`test`.`a`.`limit_user` = 0) OR IF(ISNULL(`test`.`b`.`info_uid`), (`test`.`a`.`limit_user` = 3), (`test`.`a`.`limit_user` = 2) ) ), TRUE ) # 代码块2 AND <if>(is_not_null_compl(B), ( (`test`.`b`.`is_delete` = 0) AND (`test`.`b`.`info_uid` = `test`.`a`.`info_uid`) AND (`test`.`b`.`limit_uid` LIKE '%9db162b3935c4c649b47dc02ab989062%') ), TRUE ) )
这一步条件筛选与预想不一样,代码块2中条件筛选并没有在联表操作前执行,而是和 where 中的条件(代码块1)一起执行了。
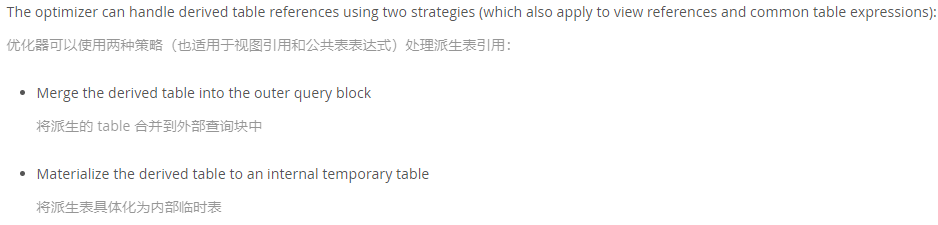
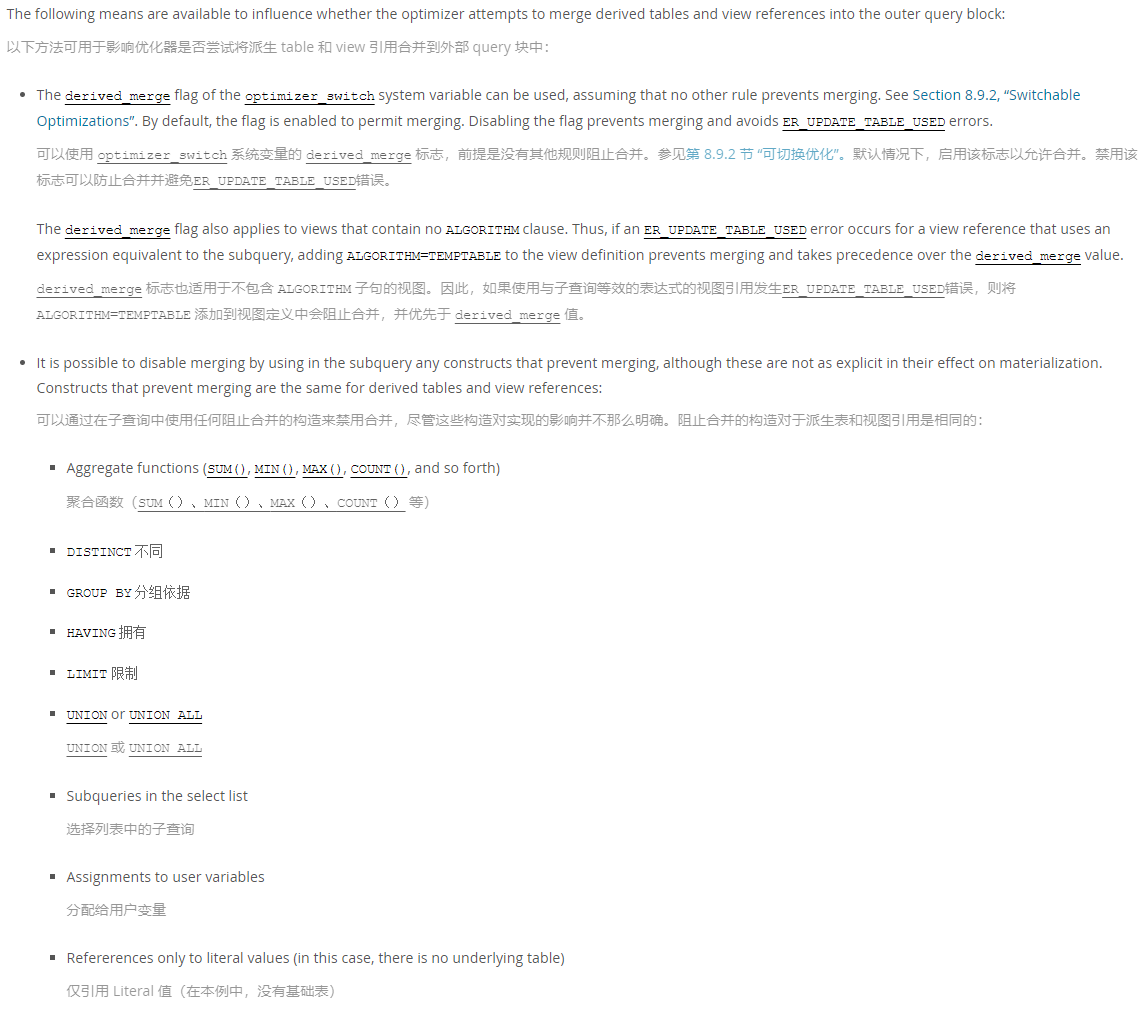
针对这个问题进行调查,去 MySQL 官方文档中寻找相关信息,在 10.2.2.4 使用合并或具体化优化派生表、视图引用和公用表表达式 这篇文档中找到了答案,如下:(注:文档版本是 MySQL 5.7 )
上面的 B 表就是一个派生表(derived table),MySQL 的优化器对派生表的优化有两种:
将派生表合并到外部查询块中
将派生表具体化为内部临时表(物化操作)
而上面 MySQL 执行的就是第1种优化操作。派生表进行物化操作涉及磁盘 I/O,MySQL 优化器觉得这样并不好,因此一般都是通过优化把派生表消除,也就是上面的第1种操作。
文档中提到,可以通过如下的方式来禁用派生表合并操作,如下:(注:文档版本是 MySQL 5.7 )
其中提到子查询中如果包含 聚合函数(SUM()、MIN()、MAX()、COUNT() 等)、DISTINCT、GROUP BY、HAVING、LIMIT、UNION、UNION ALL 都会禁用派生表合并。
尝试对 sql 进行优化,在子查询中增加 distinct,如下:
1
2
3
4
5
6
7
8
9
10
11
12
13
14
15
16
17
18
19
20
21
22
# ==== 三次优化后的 sql ==== select A.* from ( select * from t_app_circleinfo where user_uid = '02bc1fcd63514e80a7ae0a74c19945fa' and moment_type = 0 and auth_status = 2 ) A left join ( select distinct(info_uid) from t_app_circleinfo_look where is_delete = 0 and limit_uid like '%9db162b3935c4c649b47dc02ab989062%' ) B using(info_uid) where A.limit_user = 0 or ( IF(B.info_uid is null, A.limit_user = 3, A.limit_user = 2) ) ORDER BY A.update_date DESC;
运行 sql,执行耗时直接降到了 4 秒左右:
看下执行计划:
1
2
3
4
5
6
7
8
9
10
11
12
13
14
15
16
17
18
19
20
21
22
23
24
25
26
27
28
29
30
31
32
33
34
35
36
37
38
39
40
41
42
43
44
45
46
47
48
49
50
51
52
53
54
55
56
57
58
59
60
61
62
63
64
65
66
67
68
69
70
71
72
73
74
75
76
77
78
79
80
81
82
83
84
85
86
87
88
89
90
91
92
93
94
95
96
97
98
{ "query_block" : { "select_id" : 1 , "cost_info" : { "query_cost" : "197334.43" }, "ordering_operation" : { "using_filesort" : true , "cost_info" : { "sort_cost" : "8436.02" }, "nested_loop" : [ { "table" : { "table_name" : "A" , "access_type" : "ALL" , "rows_examined_per_scan" : 837571 , "rows_produced_per_join" : 837 , "filtered" : "0.10" , "cost_info" : { "read_cost" : "178607.69" , "eval_cost" : "167.51" , "prefix_cost" : "178775.20" , "data_read_per_join" : "13M" }, "used_columns" : [ ... ], "attached_condition" : "((`test`.`a`.`auth_status` = 2) and (`test`.`a`.`moment_type` = 0) and (`test`.`a`.`user_uid` = '02bc1fcd63514e80a7ae0a74c19945fa'))" } }, { "table" : { "table_name" : "B" , "access_type" : "ref" , "possible_keys" : [ "<auto_key0>" ], "key" : "<auto_key0>" , "used_key_parts" : [ "info_uid" ], "key_length" : "146" , "ref" : [ "test.A.info_uid" ], "rows_examined_per_scan" : 10 , "rows_produced_per_join" : 8436 , "filtered" : "100.00" , "using_index" : true , "cost_info" : { "read_cost" : "8436.02" , "eval_cost" : "1687.20" , "prefix_cost" : "188898.42" , "data_read_per_join" : "1M" }, "used_columns" : [ "info_uid" ], "attached_condition" : "<if>(found_match(B), ((`test`.`a`.`limit_user` = 0) or if(isnull(`b`.`info_uid`),(`test`.`a`.`limit_user` = 3),(`test`.`a`.`limit_user` = 2))), true)" , "materialized_from_subquery" : { "using_temporary_table" : true , "dependent" : false , "cacheable" : true , "query_block" : { "select_id" : 2 , "cost_info" : { "query_cost" : "23480.80" }, "duplicates_removal" : { "using_temporary_table" : true , "using_filesort" : false , "table" : { "table_name" : "t_app_circleinfo_look" , "access_type" : "ALL" , "rows_examined_per_scan" : 113399 , "rows_produced_per_join" : 1259 , "filtered" : "1.11" , "cost_info" : { "read_cost" : "23228.83" , "eval_cost" : "251.97" , "prefix_cost" : "23480.80" , "data_read_per_join" : "748K" }, "used_columns" : [ ... ], "attached_condition" : "((`test`.`t_app_circleinfo_look`.`is_delete` = 0) and (`test`.`t_app_circleinfo_look`.`limit_uid` like '%9db162b3935c4c649b47dc02ab989062%'))" } } } } } } ] } } }
执行计划中多了派生表,注意看 B 表中多了 materialized_from_subquery,这说明 B 表被物化了,最终 join 连接后的数据只有 8436 条。
使用 Hints 禁用派生表合并 上面阅读的 MySQL 文档是 5.7 版本的,中间切换到 8.0 版本的文档,发现在 MySQL 8.0 中可以通过 Hints(优化器提示)来禁用派生表合并,如下:
具体文档见 10.9.3 Optimizer Hints
本地的数据库版本是 MySQL 8.0.17,调整 sql,移除 distinct,增加 Hints 信息,如下:
1
2
3
4
5
6
7
8
9
10
11
12
13
14
15
16
17
18
19
20
# ==== MySQL 8.0 中使用 Hints 禁用派生表合并 ==== select /*+ NO_MERGE(B) */ A.* from t_app_circleinfo A left join (select info_uid from t_app_circleinfo_look where is_delete = 0 and limit_uid like '%9db162b3935c4c649b47dc02ab989062%' ) B using(info_uid) where A.user_uid = '02bc1fcd63514e80a7ae0a74c19945fa' and A.moment_type = 0 and ( A.limit_user = 0 or ( IF(B.info_uid is null, A.limit_user = 3, A.limit_user = 2) ) ) and A.auth_status = 2 ORDER BY A.update_date DESC;
执行计划如下,可以看到派生表正常生成了:
原 sql 执行耗时分析 先看下上面提到的原 sql 中查询结果有误的问题,问题出现在原 sql 中的子查询语句中:
1 2 3 4 5 IF((select FIND_IN_SET('9db162b3935c4c649b47dc02ab989062' , limit_uid) from t_app_circleinfo_look l where i.info_uid = l.info_uid and l.is_delete = 0 ) = 0 , limit_user = 3 , limit_user = 2 )
FIND_IN_SET 函数用于查找一个字符串是否在由逗号分隔的字符串列表中。如果找到,则返回字符串在列表中的位置(从1开始);如果找不到,则返回0;如果给出的字符串列表为 null,那么结果也返回 null。
上面这段 sql 做的工作是 判断 limit_uid 中是否【不包含】 9db162b3935c4c649b47dc02ab989062 字符 。正常逻辑下,如果 limit_uid 为 null,那么 limit_uid 中肯定不存在指定字符 。但实际上 FIND_IN_SET('9db162b3935c4c649b47dc02ab989062', null) 返回的值为 null,如下:
null = 0 结果为 false,也就是说 limit_uid = null 时【不包含】指定字符false,等同于 limit_uid = null 时【包含】指定字符
1 2 3 4 5 IF((select FIND_IN_SET('9db162b3935c4c649b47dc02ab989062' , limit_uid) from t_app_circleinfo_look l where i.info_uid = l.info_uid and l.is_delete = 0 ) > 0 , limit_user = 2 , limit_user = 3 )
在对原 sql 进行分析后,发现其实可以去除 FIND_IN_SET 函数,直接将原 sql 中的子查询优化为如下的形式,完整 sql 如下:
1
2
3
4
5
6
7
8
9
10
11
12
13
14
15
16
17
select * from t_app_circleinfo i where user_uid = '02bc1fcd63514e80a7ae0a74c19945fa' and moment_type = 0 and ( limit_user = 0 or ( IF((select count(1) from t_app_circleinfo_look l where i.info_uid = l.info_uid and l.limit_uid like '%9db162b3935c4c649b47dc02ab989062%' and l.is_delete = 0) > 0, limit_user = 2, limit_user = 3) ) ) and auth_status = 2 ORDER BY update_date DESC;
优化后的 sql 还是包含【依赖子查询】,对它进行分析下,它的执行计划如下:
1
2
3
4
5
6
7
8
9
10
11
12
13
14
15
16
17
18
19
20
21
22
23
24
25
26
27
28
29
30
31
32
33
34
35
36
37
38
39
40
41
42
43
44
45
46
47
48
49
50
51
52
53
54
55
56
57
58
59
60
{ "query_block" : { "select_id" : 1 , "cost_info" : { "query_cost" : "179612.77" }, "ordering_operation" : { "using_filesort" : true , "cost_info" : { "sort_cost" : "837.57" }, "table" : { "table_name" : "i" , "access_type" : "ALL" , "rows_examined_per_scan" : 837571 , "rows_produced_per_join" : 837 , "filtered" : "0.10" , "cost_info" : { "read_cost" : "178607.69" , "eval_cost" : "167.51" , "prefix_cost" : "178775.20" , "data_read_per_join" : "13M" }, "used_columns" : [ xxx ], "attached_condition" : "((`test`.`i`.`auth_status` = 2) and (`test`.`i`.`moment_type` = 0) and (`test`.`i`.`user_uid` = '02bc1fcd63514e80a7ae0a74c19945fa') and ((`test`.`i`.`limit_user` = 0) or if(((/* select#2 */ select count(1) from `test`.`t_app_circleinfo_look` `l` where ((`test`.`l`.`is_delete` = 0) and (`test`.`i`.`info_uid` = `test`.`l`.`info_uid`) and (`test`.`l`.`limit_uid` like '%9db162b3935c4c649b47dc02ab989062%'))) > 0),(`test`.`i`.`limit_user` = 2),(`test`.`i`.`limit_user` = 3))))" , "attached_subqueries" : [ { "dependent" : true , "cacheable" : false , "query_block" : { "select_id" : 2 , "cost_info" : { "query_cost" : "23480.80" }, "table" : { "table_name" : "l" , "access_type" : "ALL" , "rows_examined_per_scan" : 113399 , "rows_produced_per_join" : 125 , "filtered" : "0.11" , "cost_info" : { "read_cost" : "23228.83" , "eval_cost" : "25.20" , "prefix_cost" : "23480.80" , "data_read_per_join" : "74K" }, "used_columns" : [ xxx ], "attached_condition" : "((`test`.`l`.`is_delete` = 0) and (`test`.`i`.`info_uid` = `test`.`l`.`info_uid`) and (`test`.`l`.`limit_uid` like '%9db162b3935c4c649b47dc02ab989062%'))" } } } ] } } } }
按照这个执行计划,外查询中最终符合条件的有 837 条数据,也就是极端情况下,这 837 条数据都需要执行一次依赖子查询。但是实际情况中,如果数据的 limit_user = 0,那么就不会执行子查询了。 那么就来看下,这个 sql 查询出了多少 limit_user != 0 的数据,如下:
也就是说,上面的 sql 中,只有 28 条数据执行了【依赖子查询】。为了验证是不是这个原因导致的,将原先新增的 100w 条数据修改,使其全部能够触发【依赖子查询】,看看执行耗时的变化,修改如下:
1
2
3
4
5
update t_app_circleinfo set user_uid = '02bc1fcd63514e80a7ae0a74c19945fa', moment_type = 0, auth_status = 2 where info_uid like '%test%';
这时应该会有 1000028 条数据触发【依赖子查询】
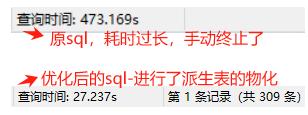
原 sql 和最终优化后的 sql 耗时对比如下:
原 sql 耗时过长,影响了数据库中其他语句的执行,因此只能手动终止。优化后的 sql 执行耗时也有所增加,因为原先只有 28 条数据会进行下面 or 后面的条件判断,而调整了测试数据后,进入这个条件判断的数据增加了 100w 条:
1
2
3
4
A.limit_user = 0 or ( IF(B.info_uid is null, A.limit_user = 3, A.limit_user = 2) )
通过这个对比,可以清晰的看到【依赖子循环】存在的性能问题。
总结 本篇对上一篇中 sql 优化失败的原因进行了分析,理清了上篇中没有解释清楚的两个疑问:①.原 sql 中存在【依赖子查询】但执行耗时反而很短;②. 优化为 join 的 sql 执行耗时反而更长。 并通过 【派生表物化】的方式成功了完成了 sql 的优化。
对于 sql 语句的优化操作包含两种:①. 优化 sql 优化;②. 创建索引。本次 sql 优化操作仅仅是对 sql 语句进行了优化,并没有额外添加索引,添加索引后 sql 的执行耗时应该能够更短。目前的数据量较少,暂时没有添加索引的必要,之后数据量增多查询耗时很长时,可以再考虑为对应的表创建合适的索引。
参考文档 MySQL执行计划
MySQL索引原理及慢查询优化
MySQL 5.7 官方文档
条件下推到物化表 - 淘宝数据库团队
MySQL常见SQL错误用法 - 淘宝数据库团队
Mysql深度讲解 – 派生表